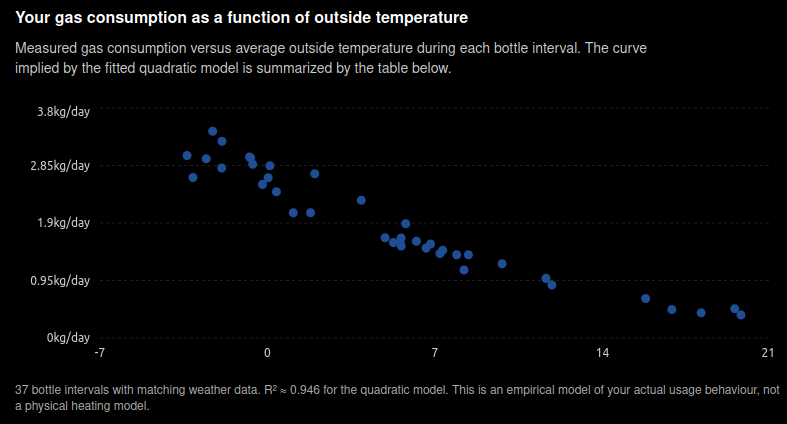
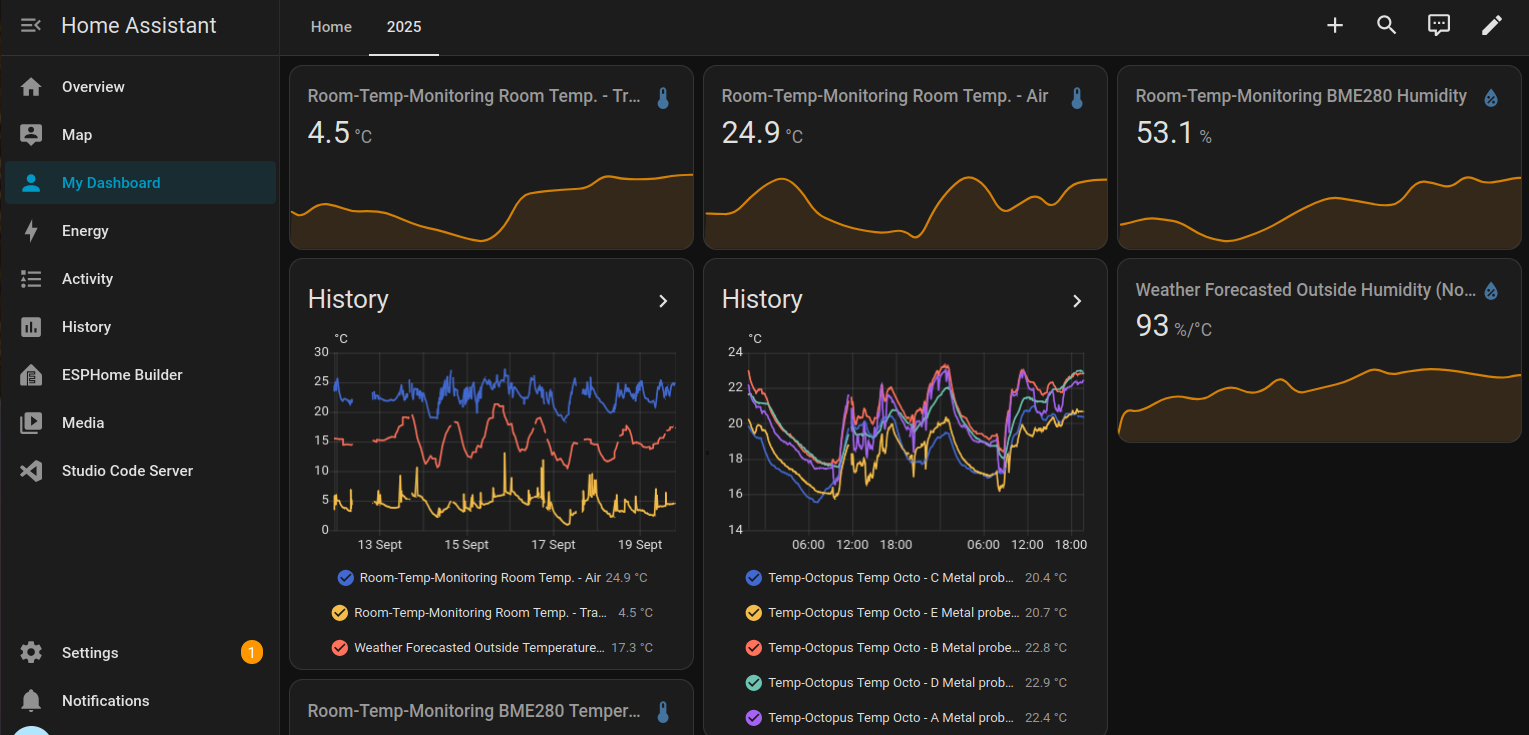
Over the past year I’ve recorded every time I connected a new 11 kg gas bottle to my caravan, including the exact date and time. At the same time, Home Assistant recorded the outside temperature throughout.
With these two datasets, I could look at the relationship between outside temperature and actual gas consumption.
I got the following empirical function:
G(T) = 2.616 – 0.1837T + 0.003553T^2
where:
* G = gas consumption in kg/day
* T = average outside temperature in C
This is not a laboratory experiment, the model reflects my actual use of the caravan and heating.
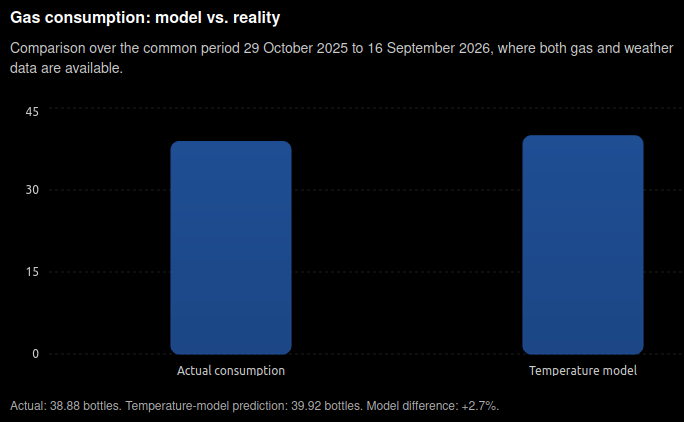
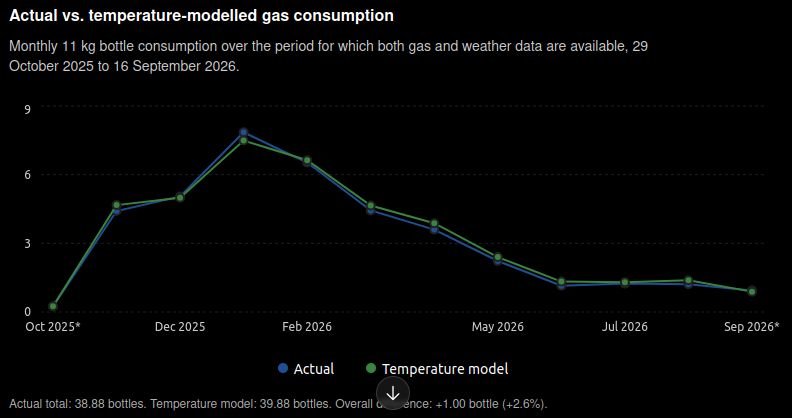
When I fed the actual temperature history back through the model, it predicted 39.9 bottles for the period with matching weather data.
Actual consumption: 38.9 bottles. – That’s only a 2.6% difference.
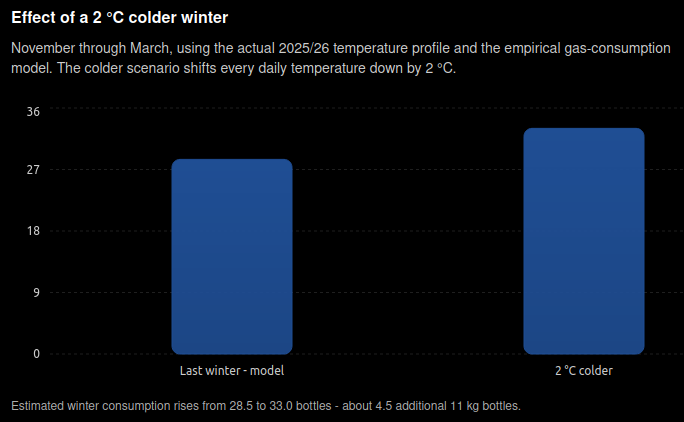
And if I use the model to simulate a winter that’s 2 °C colder, it predicts roughly 5 additional 11 kg bottles.
Apparently, even a caravan can become a small data-science project.
Data:
* Measurement period: 16 Sep 2025 -> 17 Sep 2026
* Caravan: 4.5 x 2.0 m
* Gas: heating, refrigerator and cooking
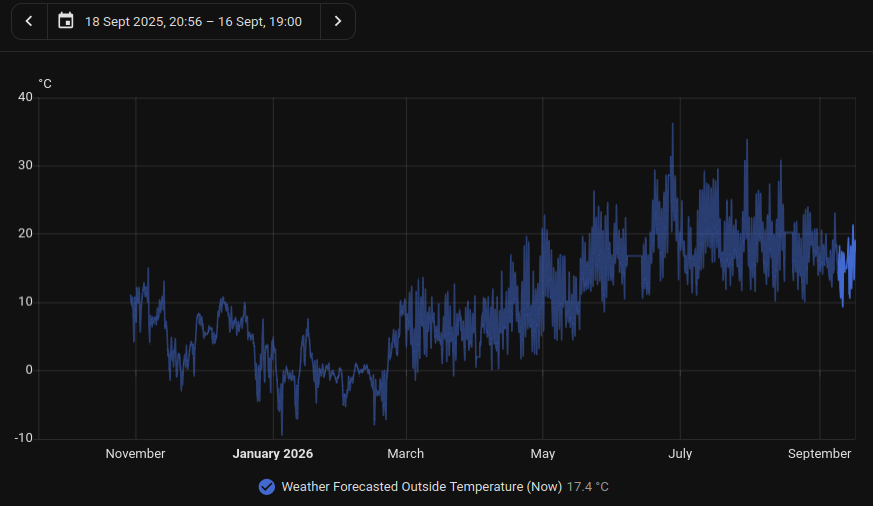
* Temperature: Home Assistant
* Gas measurements: manually recorded bottle connection times
* Model: empirical quadratic regression
* R^2 = 0.946
* Weather data available from 29 Oct 2025
* Heating use varied depending on whether I was at work or at home
* On colder days I generally turned the heating down rather than off
* Gas was also used for the refrigerator and cooking
The refrigerator and cooking probably account for roughly one bottle/month during the warmer months, so the temperature-dependent part is primarily the heating.